
Admissions teams see this problem daily. Many applicants (and the staff reviewing their files) struggle to figure out what a foreign grade actually translates to on a familiar US scale.
This guide provides country-specific reference charts for comparing international grades against common US formats: letter grades, percentages, and the 4.0 GPA scale.
One caveat before you dive in: these charts are research-based reference points. They are not universal formulas, and they don't replace an institution's published grading policy or a formal credential evaluation.
Key Takeaways
- Math-only conversions misrepresent foreign grades when pass thresholds and distributions differ.
- Always flag scale direction; a lower number can mean a stronger result.
- Registrar policies, not online charts, should govern GPA and transfer decisions.
- Use charts as a starting point; confirm requirements with the receiving institution.
What Does Grade Conversion by Country Mean?
Grade conversion is the process of interpreting an academic result from one country's grading system in terms that a different system can understand. It sounds simple. It rarely is.
A few related but distinct tasks often get lumped together under this one term:
- Percentage-to-letter conversion: translating a raw percentage into an A–F letter grade
- Letter-to-GPA conversion: assigning grade points (4.0, 3.0, and so on) to a letter
- Country-specific credential interpretation: matching an entire grading system to its closest US equivalent
- Course-by-course evaluation: assessing individual courses for credit and content, not just a final grade
These overlap, but they aren't interchangeable. A grade's real meaning depends on the country's scale, whether it ascends or descends, the minimum passing mark, the grade descriptors used, and the academic context in which it was awarded.
It gets more complicated still: one country can run multiple systems at once. Greece, for example, uses a 20-point scale in secondary school and a separate 0-10 scale at the university level. A country label alone can't tell you which system applies.
Throughout this guide, we use the common US reference point of letter grades and the 4.0 GPA scale:
| Letter | A | B | C | D | F |
|---|---|---|---|---|---|
| Typical GPA points | 4.0 | 3.0 | 2.0 | 1.0 | 0.0 |
That said, even US institutions don't calculate GPA identically. According to AACRAO's EDGE guide, a reliable equivalency depends on the grade's native meaning, grade distribution, and assessment approach, not denominators alone. Verify exact cutoffs with the receiving school's registrar before you apply any chart.
Country-by-Country Grade Conversion Charts
Below is a condensed reference chart, grouped by grading format rather than listed alphabetically by country. Verify every row against the institution's own transcript legend before using it for anything official.
| Country | Grading format | Direction | High-performance descriptor | Passing convention | Approx. US read |
|---|---|---|---|---|---|
| United Kingdom | % + degree classification | Ascending | First Class, 70%+ | Varies by institution | First ≈ A range, but not a direct % match |
| India (UGC) | 10-point (O, A+, A...) | Ascending | O = Outstanding | P = Pass (grade point 4) | Depends on program; points aren't US GPA points |
| Brazil | 0–10 | Ascending | 9–10 Excellent | 5–7.5, varies by subject | No single national cutoff |
| Spain | 0–10 | Ascending | 9–10 Sobresaliente | 5 | Regional/institutional variation applies |
| Netherlands | 1–10 | Ascending | 8+ considered strong | 5.5–6, varies | Mid-range marks are common and solid |
| Greece (higher ed) | 0–10 | Ascending | 8.5–10 Excellent | 5 | Secondary school uses a separate 20-point scale |
| Vietnam | 0–10 | Ascending | 9–10 Outstanding | 4–5, varies by subject | Dividing by 2.5 to reach "4.0" is unreliable |
| Russia (secondary) | 2–5 | Ascending | 5 Excellent | 3 | 2 rarely appears on an actual transcript |
| Germany (higher ed) | 1–5 | Descending | 1 Very Good | 4 | A lower number means a stronger result |
| Argentina | 0–10, varies by level | Ascending | 9–10 Sobresaliente | 6 (secondary) / 4 (higher ed) | Passing mark shifts by education level |
| Portugal | 0–20 | Ascending | 18–20 Excellent | 10 | Twenty-point scale, not a percentage |
| France | 0–20 | Ascending | 16–20 Very Good | 10 | Passing sits near the midpoint, not 50% |
| Australia (Sydney) | Descriptor bands | Ascending | High Distinction, 85+ | Pass, 50–64 | Bands are institution-specific |
| Canada (UBC) | Letter + % | Ascending | A+, 90–100 | Varies by faculty | Structurally closest to US letter grades |
Systems That Commonly Cause Confusion
A few systems trip up even experienced reviewers:
- Germany reverses the usual logic. A "1" is the top mark, and "4" is a passing grade, while "5" means fail.
- The Philippines uses numerical bands that have changed under recent education department orders. Always check which version of the scale applies to the applicant's graduation year.
- Argentina splits its pass marks by education level. Nuffic's Argentina profile puts secondary passing at 6 and higher-education passing at 4, both on a 10-point scale, not the 20-point structure sometimes assumed.
- The United Kingdom reports percentages, but a 70% isn't read the same way as a US 70%. It sits at the First-Class boundary, one of the strongest results a UK student can earn.
These charts are reference interpretations, not guaranteed admissions, transfer-credit, licensing, or scholarship equivalencies. Always confirm the awarding institution, transcript legend, and education level first.
Common Grading-Scale Formats and How They Differ
Readers researching international transcripts run into several recurring formats:
- Percentages and raw scores
- 4.0 or 5.0 GPA scales
- 10-point and 20-point numerical scales
- Letter grades and degree classifications
- Descriptors such as "Distinction" or "Credit"
- Pass/fail and standards-based marks
Ascending vs. Descending Scales
Scale direction matters. In France, a 16 out of 20 is a strong result on an ascending scale. In Germany, a "1" is the strongest result on a descending scale. Flip the direction without noticing, and a top student's record can look like a failing one.

Factors That Complicate Interpretation
Several transcript details change how a grade should be read:
- Plus/minus grades can shift GPA points by a fraction, depending on institutional policy
- Rounding rules (5.5 rounding up to 6 in some Dutch programs, for instance) affect whether a grade counts as passing
- Weighted courses give higher-credit classes more influence over a final average
- Repeated courses, withdrawals, and incompletes may or may not factor into a cumulative GPA
- Pass/fail marks typically get excluded from GPA calculations altogether
Credit frameworks are separate from grading scales. ECTS, the European credit system, describes learning volume and workload, not a grade conversion formula.
Its old A-E letter scale was retired in 2009 in favor of grade-distribution tables. Treating ECTS credits as a stand-in for a 4.0 GPA conversion is a common and avoidable mistake.
No grading system is inherently more rigorous than another. Grading practices and performance distributions only make sense within their original academic context.
How to Convert an International Grade to a US 4.0 Scale
A reliable conversion follows a process, not a shortcut. Here's the five-step version admissions staff and evaluators typically rely on:
- Identify the source details — country, awarding institution, education level, program, and the exact grading scale printed on the transcript.
- Locate the official grading policy — find the transcript legend or institutional policy, including descriptors and the minimum passing mark.
- Determine the scale's direction — confirm whether it's ascending or descending, and whether the figure is a course grade, final classification, percentage, or cumulative GPA.
- Match to a researched interpretation — use a country-specific reference rather than dividing by the maximum score automatically.
- Apply the receiving institution's policy — follow its rules for GPA calculation, credits, repeats, exclusions, and rounding.

Why Dividing Isn't the Same as Converting
Here's a generic, illustrative example (not an official equivalency): a student with an 8 out of 10 might assume that's a straight 3.2 on a 4.0 scale. But if the institution's passing mark sits at 4 out of 10, not 5, that 8 could represent a stronger relative performance than the raw math suggests.
U.S. Embassy Vietnam guidance makes this point directly about Vietnam's 10-point scale: a straightforward 10-becomes-4.0 conversion "is completely inaccurate," since several subjects require a minimum score of 5 out of 10 just to pass.
Converting a single grade is one task. Converting a full transcript is another. That requires course credits or units, individual grades, academic level, and the receiving institution's specific policy, not just one final number.
Reverse conversions carry the same risk. Estimating a percentage from a US GPA sounds useful, but an averaged GPA can't reliably produce one exact percentage. Too much detail gets lost in the averaging.
Documents to Gather Before You Start
- Official transcript
- Grading-scale legend or policy document
- Diploma or degree certificate, where required
- Certified translations
- Course and credit information
- Any institution-specific submission instructions
Why a Grade Conversion Chart Is Not an Official Evaluation
Charts give you orientation. They don't make a final decision for you.
Official outcomes, whether admissions, transfer credit, or licensing, often require a formal credential evaluation, direct institutional review, authenticated records, or course-by-course assessment. A reviewer typically weighs:
- Institutional recognition and accreditation status
- Program length and course content
- Credits earned and grading distribution
- Transcript authenticity
- Academic level
- Local grading conventions
Two applicants with the same numerical grade can receive different interpretations if their countries, institutions, programs, or transcript legends differ. Admissions, transfer-credit, professional licensing, immigration, scholarship, and employment decisions may each apply different evaluation standards.
Always confirm the receiving organization's specific requirement before assuming a chart settles the question.
For higher-education teams, a dependable workflow preserves the original grade, the converted value, the rationale behind it, the source data, the policy version applied, and a human review trail. It does not overwrite the source record the moment a conversion happens.
This is where purpose-built software like TruEnroll fits in. It works as institutional infrastructure rather than a replacement for official evaluation providers.
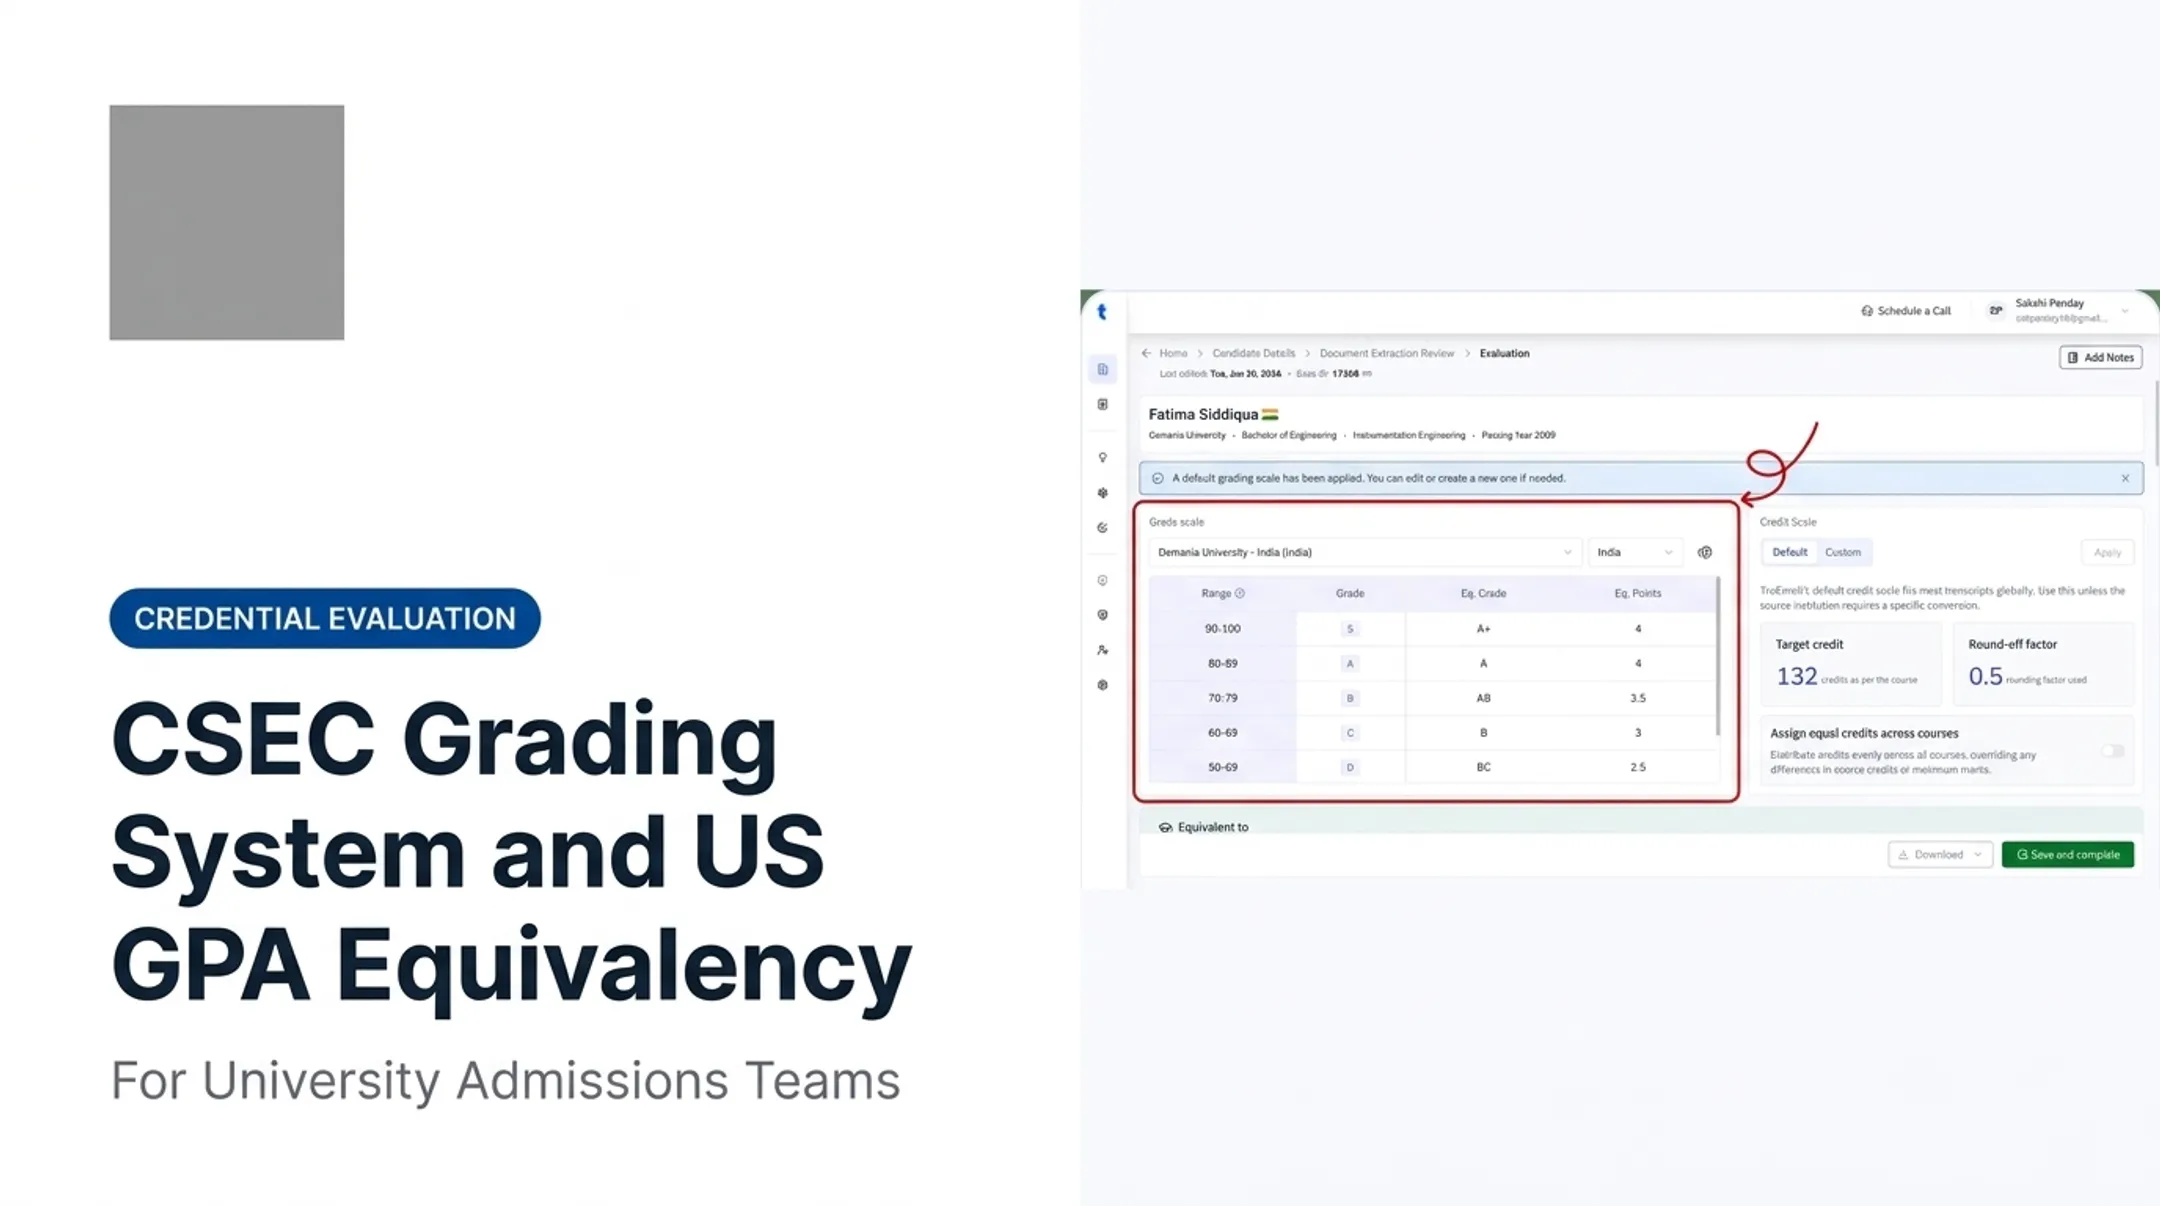
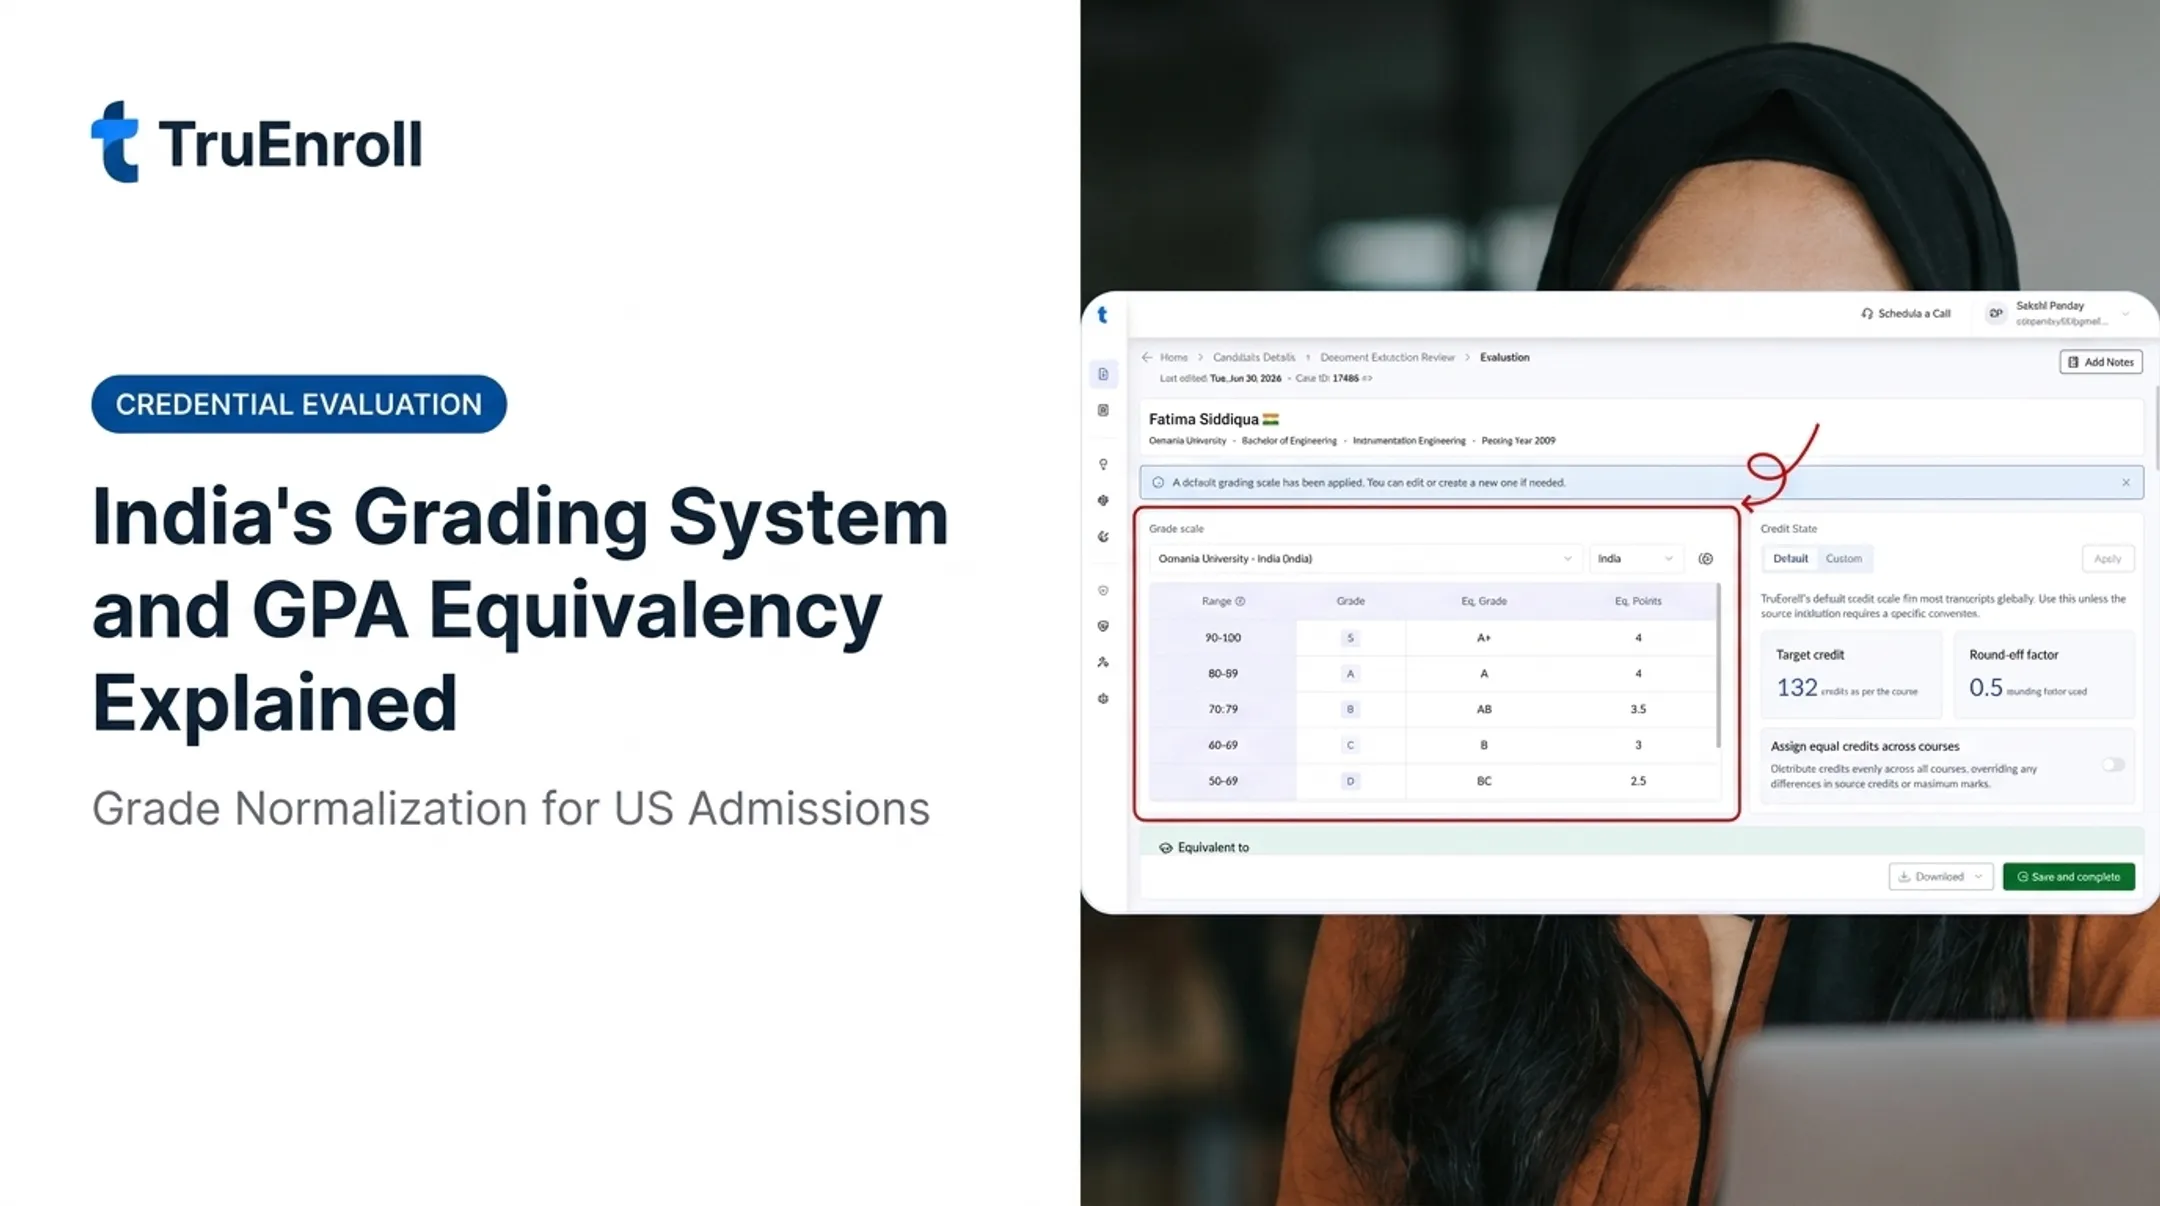
TruEnroll interprets extracted grades against the issuing institution's own grading scale, using a library of more than 150 pre-configured international grading systems, before converting them to a target scale. Registrars keep full control over exclusions, repeated-course handling, and rounding rules.
The platform also:
- Links every converted field back to its exact source coordinate on the original transcript
- Screens documents against more than 70 fraud indicators before human sign-off
- Gives reviewers faster, more traceable information without replacing institutional judgment
How Universities Can Manage Country-Specific Grade Conversion at Scale
Grade conversion stops being a reference problem and becomes an operations problem once application volume climbs. A workable framework for admissions and registrar teams usually includes:
- A governed country-and-institution rules library, reviewed periodically rather than set once and forgotten
- Documented exceptions for unusual programs or legacy grading policies
- Routing for ambiguous records to a human reviewer instead of an automatic default
Multimodal transcript processing cuts manual data entry while preserving the original document, extracted values, conversion rationale, and an audit-ready verification trail.
TruEnroll's zero-template processing has helped institutions move multi-week international evaluation backlogs down to same-day or three-minute reviews. Reported field-level accuracy sits around 99.4%, with more than 35 minutes saved per transcript file.

Strong validation controls matter just as much as speed. Flag records with:
- Unrecognized or unaccredited institutions
- Signs of document alteration
- Missing grading legends
- Inconsistent internal calculations
- Unusual grade patterns or conflicting transcript data
Faster processing should produce cleaner downstream records, not riskier ones. Automation should support transparent, policy-compliant decisions. It should never conceal uncertainty, and it should never turn an approximate chart into an automatic admissions decision on its own.
Frequently Asked Questions
How do I convert my grade to a 4.0 scale?
Start by identifying the original country, institution, and exact grading scale on the transcript. Then apply a researched country-specific reference or the receiving institution's own method. Direct mathematical division is often inaccurate.
What is the conversion of grades in college?
College grade conversion depends on the institution, country, course credits, grading policy, and the purpose of the conversion. A rough GPA estimate and an official credential evaluation are not the same thing.
What is a 3.7 GPA on a 10 scale?
There's no universal answer, since 10-point scales differ by country and institution. Check the transcript legend and confirm with the receiving institution rather than relying on one fixed conversion number.
What is the grading scale 1, 2, 3, 4?
A 1-to-4 scale might represent mastery levels, GPA points, or a country-specific grading system, depending on context. Confirm the meaning and direction from the issuing institution's grading policy before assuming anything.
What is the grading system in Argentina?
Argentina typically uses a 0-to-10 scale, with secondary school passing at 6 and higher education passing at 4, according to Nuffic's country profile. Universities can still differ in scale, descriptors, and how US institutions choose to interpret the record.