The Institutional Guide to 4.0 GPA Conversion: Standards, International Normalization, and Automated Recalculation


Admissions offices evaluate transcripts from thousands of disparate academic environments in every cycle. A single applicant pool might include a local high school reporting on a 5.0 weighted scale, an out-of-state transfer with non-standard quality point increments, an Indian university listing percentage marks on a 10-point scale, and a British institution awarding Honours degree classifications. Standardizing these records into a normalized 4.0 scale is critical for equitable admissions, scholarship allocations, and institutional compliance.
Institutional Governance Notice - This operational guide is created specifically for university admissions directors, transfer articulation officers, and credential analysts establishing institutional recalculation rules and automated intake pipelines. It does not provide student GPA calculators, high school grade lookup widgets, or personal transcript request services.
When credential analysts must manually strip non-academic electives, look up historical grading legends, and recalculate grade point averages using desktop calculators or spreadsheets, applicant queues stall. Establishing automated, policy-governed recalculation workflows allows institutions to execute fair, standardized reviews while eliminating cycle backlogs.
The Definitive Benchmark: College Board GPA Conversion to 4.0
In standard US higher education administration, a GPA conversion to 4.0 translates letter grades or percentage ranges into standardized numerical quality points between 0.0 and 4.0. Quality points reflect academic achievement per credit unit, providing an unweighted baseline for cross-institutional comparison regardless of the sending school's internal grading variations.
The most widely recognized domestic baseline is the College Board GPA conversion framework, which maps percentage intervals to letter grades and fixed quality points.
The Standard College Board 4.0 Conversion Grid
Letter Grade | Percentage Interval | 4.0 Quality Points | Standard Evaluator Notation |
|---|---|---|---|
A+ | 97 – 100% | 4.0 | Maximum unweighted point value. |
A | 93 – 96% | 4.0 | Standard benchmark for excellence. |
A- | 90 – 92% | 3.7 | High honors baseline. |
B+ | 87 – 89% | 3.3 | Above-average competency. |
B | 83 – 86% | 3.0 | Core institutional transfer requirement. |
B- | 80 – 82% | 2.7 | Minimum baseline for select major prerequisites. |
C+ | 77 – 79% | 2.3 | Average competency. |
C | 73 – 76% | 2.0 | Standard minimum grade for transferable credit. |
C- | 70 – 72% | 1.7 | Typically, ineligible for prerequisite satisfaction. |
D+ | 67 – 69% | 1.3 | Below-average performance. |
D | 65 – 66% | 1.0 | Minimum passing credit (rarely transferable). |
F | Below 65% | 0.0 | Failing grade (0 quality points earned). |
The Mathematical Formula for Quality Point Weighting
A fundamental error in preliminary application review is simple unweighted grade averaging. Institutional grade conversion requires calculating a cumulative grade point average by weighting quality points against the credit hours assigned to each completed course:

Worked Evaluator Example
Consider an incoming student with four completed courses:
ENG 101 (3.0 credits) with a grade of A (4.0 points): 3.0 X 4.0 = 12.0
BIO 110 (4.0 credits) with a grade of B (3.0 points): $4.0 x 3.0 = 12.0
MAT 150 (3.0 credits) with a grade of C+ (2.3 points): $3.0 x 2.3 = 6.9
HIS 102 (3.0 credits) with a grade of A- (3.7 points): $3.0 x 3.7 = 11.1
Total Quality Points = 12.0 + 12.0 + 6.9 + 11.1 = 42.0
Total Credit Hours = 3.0 + 4.0 + 3.0 + 3.0 = 13.0
Cumulative Recalculated GPA = 42.0/13.0 = 3.23
If an evaluator averages the raw grade point values (4.0 + 3.0 + 2.3 + 3.7) / 4, the result is 3.25—an inaccurate representation that distorts selective admissions rankings and financial aid cutoff compliance.
Institutional Policy: Unweighted Core GPAs vs. Weighted High School Scales
While the College Board scale establishes an unweighted baseline, secondary schools employ wildly disparate weighting methodologies. Evaluators regularly process high school transcripts with GPAs recorded on 5.0, 6.0, or even 12.0 scales, where Advanced Placement (AP), International Baccalaureate (IB), and dual-enrollment courses are awarded supplementary grade weights (+0.5 or +1.0 quality points).
This creates two critical challenges for university admissions operations:
Unequal Feeder School Weighting: A 4.2 GPA from a school with liberal weighting policies cannot be compared directly to a 3.8 GPA from a competitive academy that reports strictly unweighted marks.
Elective Inflation: High school GPAs often include non-academic courses (physical education, driver's education, choir, teacher aide credits) that artificially elevate the cumulative average.
To ensure parity, selective admissions offices implement a Core Unweighted Recalculation Policy. Evaluators systematically strip non-academic electives from the file, isolate core subjects (Mathematics, Natural Sciences, English, Social Sciences, and Foreign Languages), and recalculate the academic record back to a standardized 4.0 ceiling.
When executed manually, this course-by-course audit and manual recalculation takes 12 to 18 minutes per applicant file, creating severe admissions bottlenecks during November and January submission deadlines.
The Flaw of Linear Division: Normalizing International Academic Records
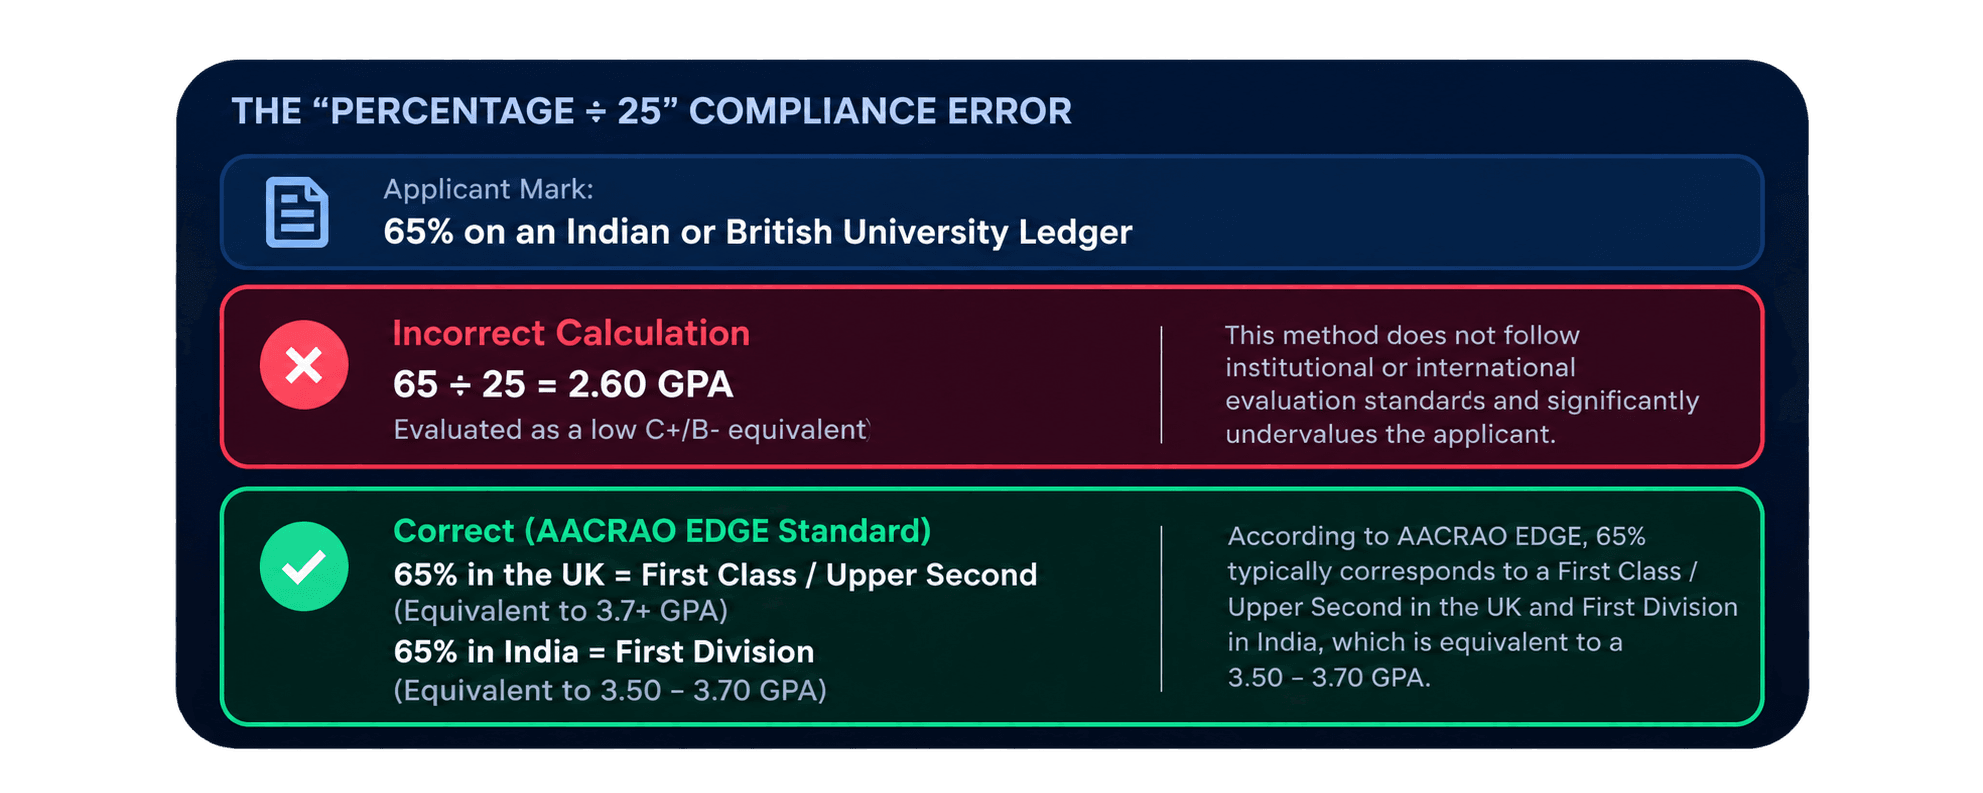
Applying domestic conversion tools like the College Board grid or linear mathematical division to international transcripts is one of the most common causes of evaluation compliance failure.
In many global education systems, marks above 70% represent outstanding academic distinction awarded to fewer than 5% of students. Using linear math artificially depresses the applicant's record, unfairly disqualifying competitive international prospects and degrading institutional recruitment yield.
Global Scale Conversion Standards (AACRAO EDGE Alignment)
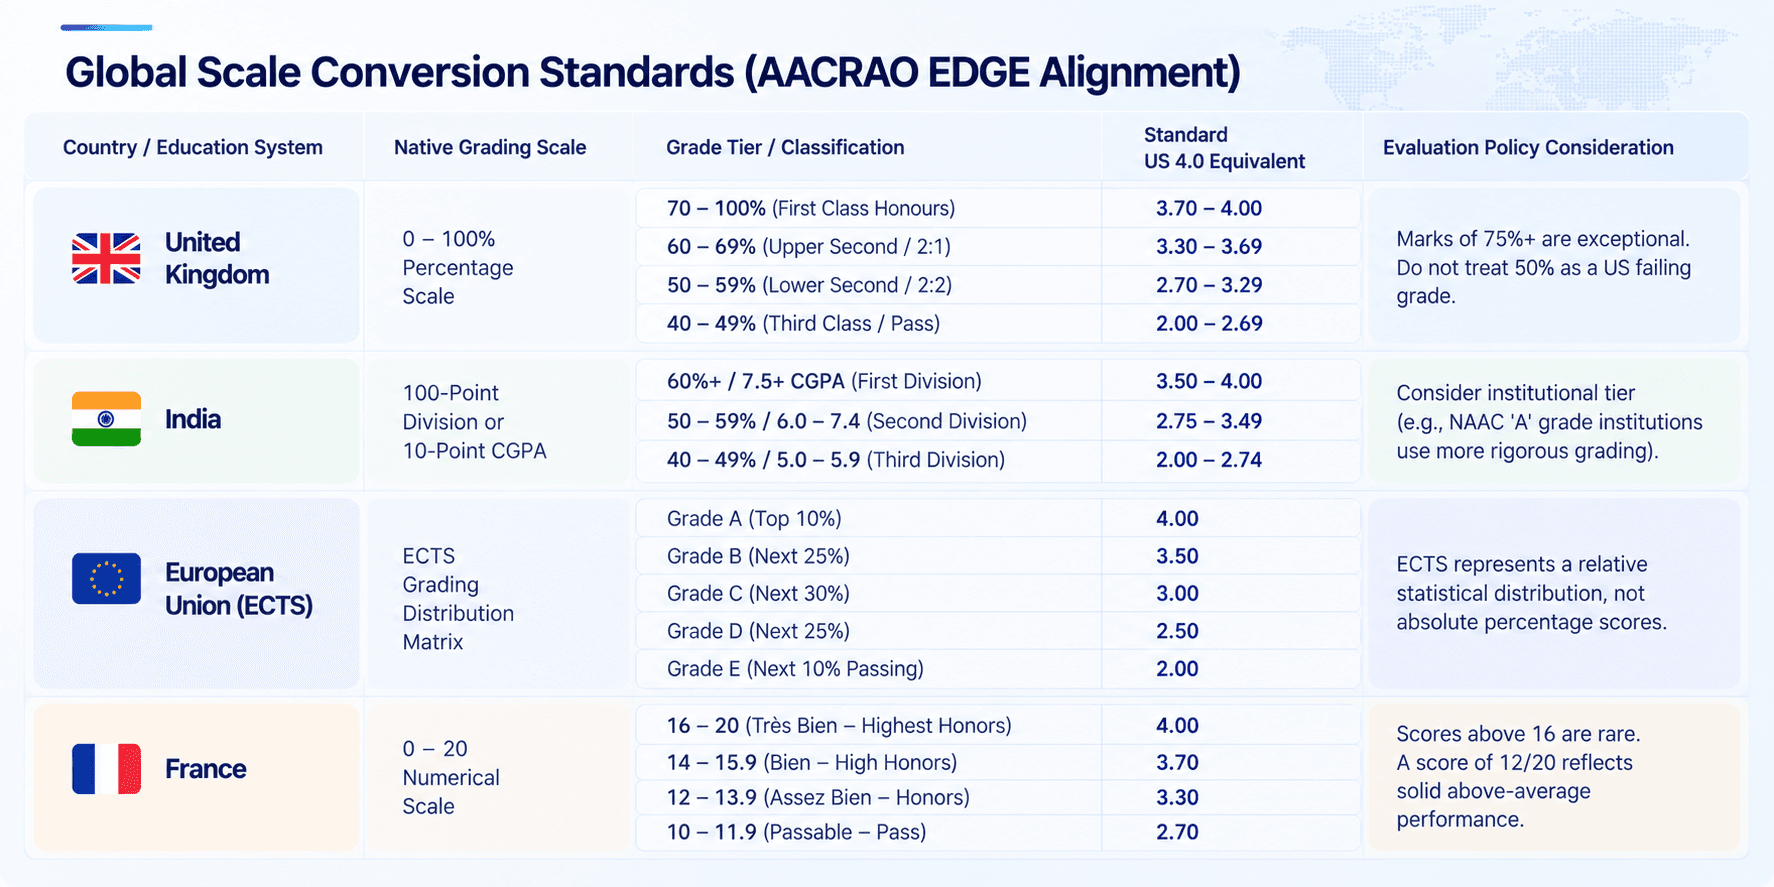
Admissions departments must codify institutional conversion policies that mirror standards defined by the American Association of Collegiate Registrars and Admissions Officers (AACRAO) Electronic Database for Global Education (EDGE) rather than ad hoc departmental spreadsheets.
The Operational Bottleneck: What Manual Grade Recalculation Costs Admissions
Manual GPA conversion creates compounding operational friction during high-volume application cycles:
Dual-Monitor Fatigue: Evaluators spend hours toggling between scanned PDF transcripts, historical grading scale lookup charts, local Excel calculation sheets, and the active SIS admissions screen.
Clerical Calculation Errors: Manual entry of non-standard quality points across dozens of course lines introduces a documented 3% to 5% calculation error rate, risking incorrect admissions decisions, misallocated merit scholarships, and accreditation audit failures.
Severe Turnaround Delays: Recalculating thousands of domestic core GPAs and foreign mark sheets creates review backlogs of two to four weeks. During this delay, admitted applicants often accept offers from competing institutions that delivered admissions decisions and merit awards faster.
The Automated Architecture: How TruEnroll Normalizes Scales in Seconds
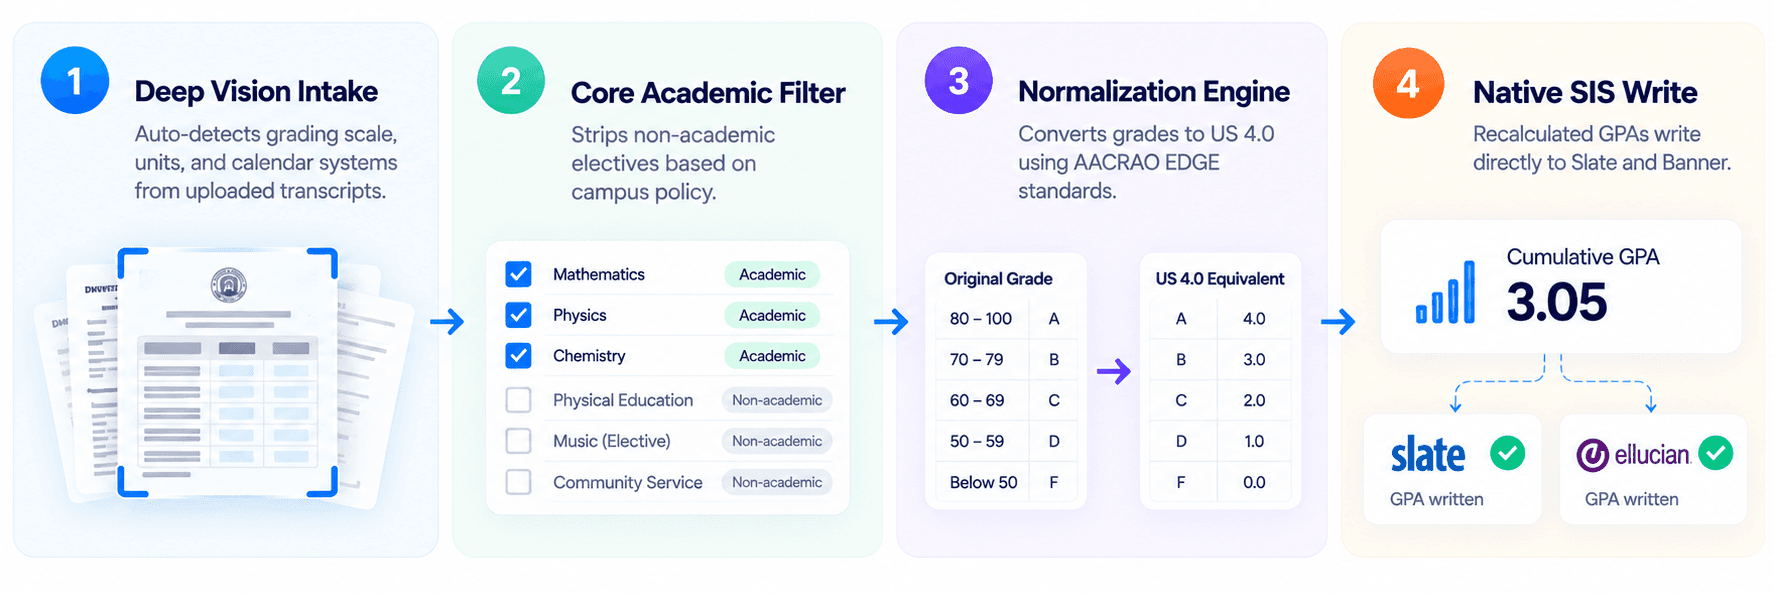
Modern transcript processing platforms eliminate manual recalculation by automating document ingestion, scale detection, and SIS integration across four stages:
1. Automated Scale & System Detection
TruEnroll inspects incoming transcripts via high-accuracy computer vision, analyzing the institutional transcript legend to identify whether the record uses standard letter grades, a 100-point domestic scale, a weighted secondary matrix, or an international division scale.
2. Core Academic Filtering
The engine matches course descriptions against institutional requirements, automatically isolating academic subjects (Math, Sciences, Humanities) and excluding physical education, attendance marks, and non-academic electives according to institutional rules.
3. Algorithmic 4.0 Normalization
The platform applies institutionally approved conversion rules to calculate standardized quality points and cumulative core GPAs instantly. Mathematical edge cases, such as fractional semester units or non-standard pass/fail credits, are resolved transparently according to pre-configured campus logic.
4. Direct SIS and CRM Writeback
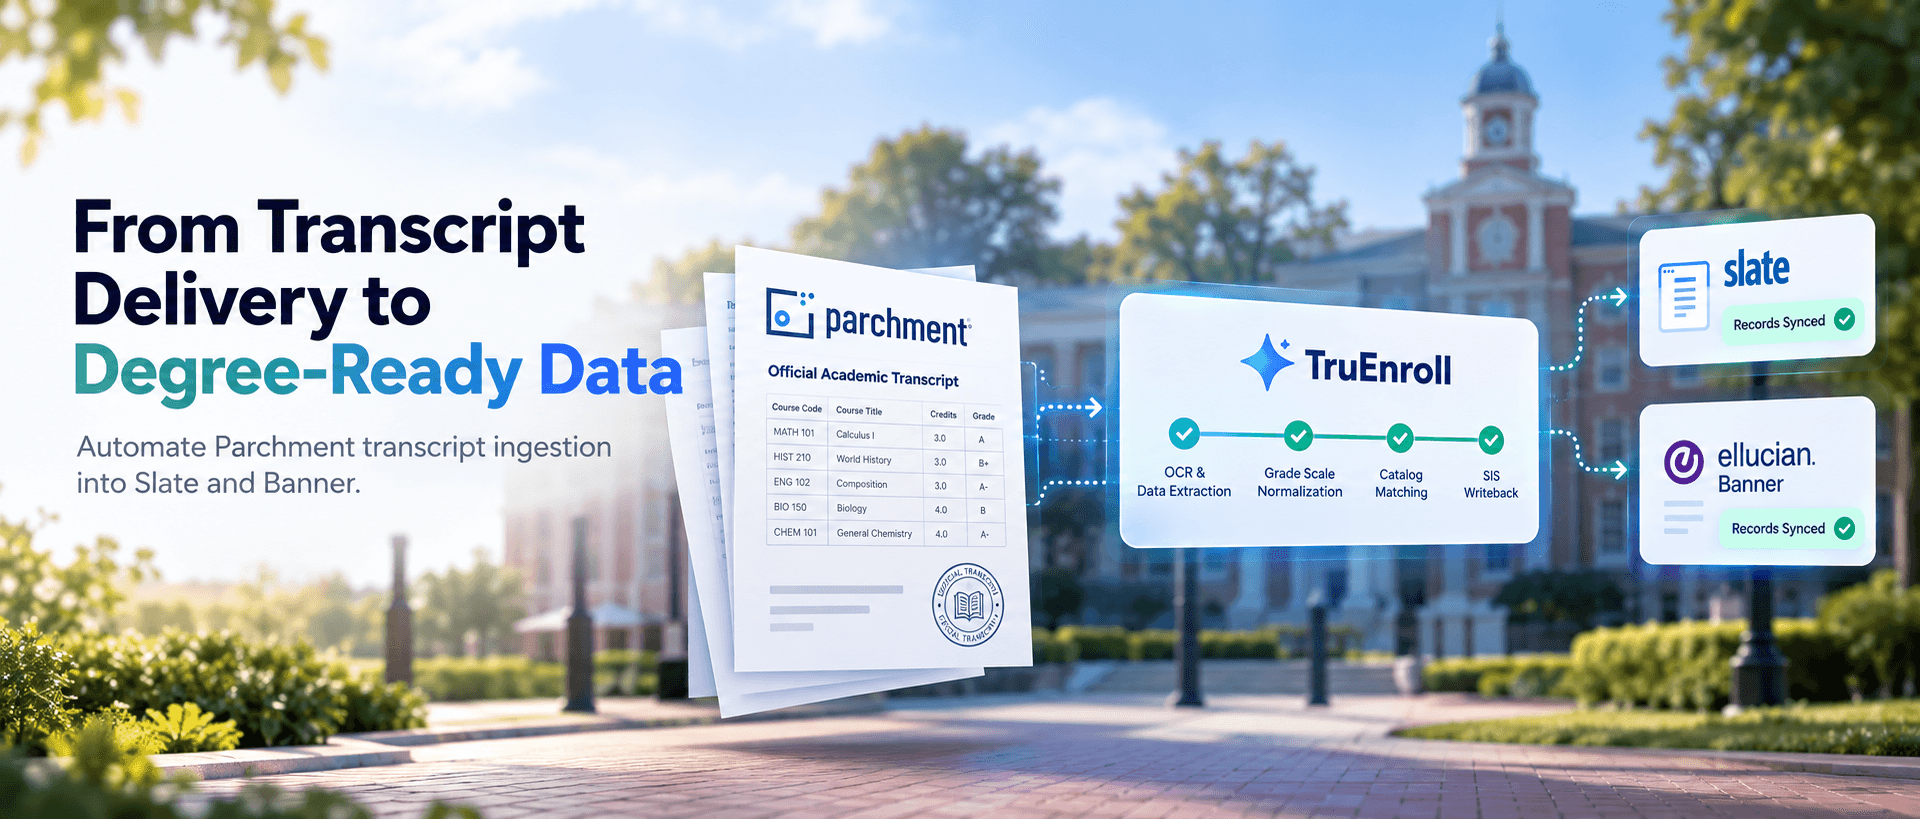
Instead of requiring staff to type verified quality points into administrative databases, the normalized data—including individual course conversions, total quality points, and recalculated cumulative GPAs—writes directly to Slate Custom Datasets, Ellucian Banner (SHATERM),or Workday Student.
Frequently Asked Questions
What is the difference between weighted and unweighted 4.0 GPA conversion?
Why can't international percentage grades be divided by 25 to determine a US 4.0 GPA?
How does the College Board GPA conversion scale differ from campus recalculation models?
How do automated admissions systems write recalculated GPAs directly into Slate and Banner?